Have you ever noticed how often we organize the world into rows and columns?
§You've been using this tool your whole life
Think about the last time you compared options for something important. Maybe you were house hunting, choosing between job offers, or just trying to pick a restaurant for date night. Chances are you made a list, probably with the options down one side and your decision criteria across the top (at least mentally you probably made something like this structure).
Congratulations, you just created a matrix.
Now, you might be thinking, "That's just common sense!" And you're absolutely right.
But this "common sense" approach has become one of the most powerful tools humans use to make sense of complex information. From tracking down terrorists to creating electronic music, from managing billion-dollar portfolios to understanding our own DNA. It all comes down to the same basic idea of organizing information into grids.
Let me show you what I mean.
§Three examples
§Making sense of technology chaos
Imagine you're an R&D engineer, and your boss just asked you to research some hairy engineering problem. You don't even know where to begin.
Engineers make this manageable by creating systematic comparison spreadsheets. Each row represents a different technology or company, for example, and the columns track things like market readiness, technical risk, competitive advantage, and system parameters.
This doesn’t predict the future. But it does something arguably more valuable: it forces you to think through what matters and compare apples to apples. Instead of drowning in research reports and expert opinions, you can see how everything stacks up against the same criteria. That overwhelming landscape of possibilities becomes a decision you can actually wrap your head around.
§Making music you can touch
And even some of the most innovative music you've heard was probably created on what's essentially a spreadsheet you can touch.
Electronic musicians use devices like the Ableton Push. This is basically a grid of buttons where each button represents a different sound, beat, or musical phrase. Instead of thinking about music as a linear sequence of notes, musicians can see and feel the structure of their songs. They can trigger complex rhythms with one finger, layer melodies by pressing multiple buttons, and build entire compositions by interacting with this physical matrix of sound.
It's like being able to reach into your music and rearrange it with your hands.
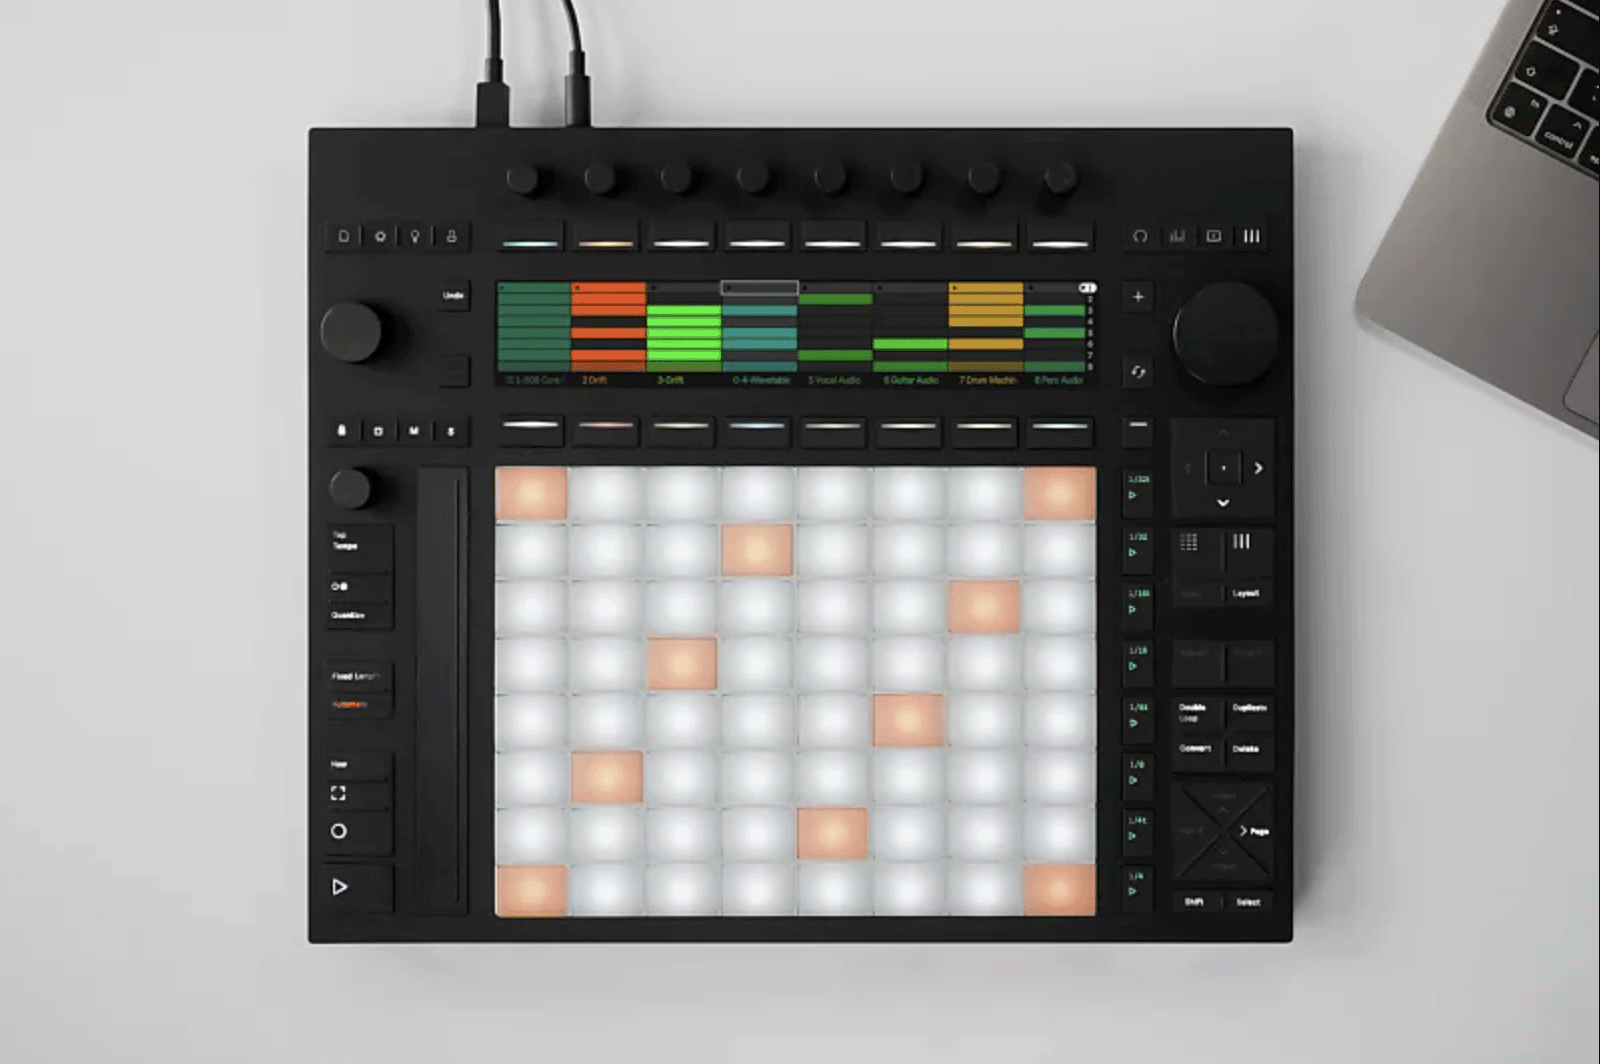
Ableton Push 3: A "spreadsheet for making music". Disclaimer: I own one and it's fantastic.
§The matrix that caught terrorists
The next example sounds like it's from a spy thriller. But it actually happened.
In 1970s Germany, investigators were trying to track down members of the Red Army Faction, a terrorist group that was incredibly good at blending into the general population. How do you find a handful of dangerous people hiding among millions of ordinary citizens?
The German federal police (BKA; specifically Horst Herold, who was Head of BKA then) came up with something called "Rasterfahndung" (”grid search”). Basically, they created massive grids where individuals were rows and suspicious behaviors were columns. This included things like unusual travel patterns, rent or utilities paid in cash, specific financial transactions, certain associations. By systematically filling in this matrix with available data, they could identify people who matched multiple suspicious criteria.
Ironically, Herold even used Ulrike Meinhoff's own writings as a blueprint. Meinhoff was an RAF terrorist who had written detailed instructions for armed combat. And Herold turned those instructions into the matrices that would help track down her organization (full story here, in German).
It worked. This matrix-based approach helped them track down terrorists and became a cornerstone of modern investigative techniques.
§It's everywhere once you start looking
The more you pay attention, the more you realize matrices are everywhere. And I mean everywhere. Here are some of my favorite examples:
§Life sciences
| What they do | Rows | Columns | What they learn |
|---|---|---|---|
| gene research | different genes | various treatments | which genes respond to what |
| drug safety | medications | other medications | dangerous combinations |
| disease tracking | population groups | risk factors | who gets sick and why |
§Business
| What they do | Rows | Columns | What they learn |
|---|---|---|---|
| investment planning | different assets | market scenarios | how to spread risk |
| customer research | customer types | product features | what people actually want |
| supply chain | suppliers | what could go wrong | where the weak spots are |
§Social sciences
| What they do | Rows | Columns | What they learn |
|---|---|---|---|
| workplace dynamics | employees | who talks to whom | the real power structure |
| cultural studies | different societies | behaviors/values | what makes cultures tick |
| survey analysis | survey respondents | their answers | hidden opinion patterns |
§Engineering
| What they do | Rows | Columns | What they learn |
|---|---|---|---|
| network design | network points | connection types | best routes for data |
| building safety | building parts | different stresses | where things might break |
| cybersecurity | company assets | possible threats | what to protect first |
§Planning & operations
| What they do | Rows | Columns | What they learn |
|---|---|---|---|
| city planning | different areas | types of buildings | what should go where |
| project management | tasks | time periods | critical bottlenecks |
| sports strategy | players | performance stats | hidden advantages |
The list goes on. Video game designers, doctors, teachers, military strategists, environmental scientists. Everyone is using some version of this same basic tool.
§Why does this simple idea work so well?
I think it’s because our brains are pattern-recognition machines, and matrices make patterns visible.
When information is scattered across emails, reports, and conversations, patterns stay hidden. But arrange that same information in a grid, and suddenly you can see things. You spot the clusters, the outliers, the trends. You notice when something's missing. You can compare options side by side instead of trying to hold everything in your head at once.
Plus, matrices enforce clarity. When you set up a matrix, every intersection of row and column creates a little question: "What goes here?" It forces you to be thorough in a way that free-form thinking often does not.
§The future is still grid-shaped
As AI advances, matrices are becoming more important, not less.
Why?
Because now we can use AI to help us build these grids in the first place.
Think about it: the hardest part of creating a useful matrix is figuring out what should go in the rows and columns, then filling in all those cells with research. Done manually, this is days, weeks, months of manual work.
Now AI can help generate the framework, suggest what criteria matter most, and swarms of AI agents can go off and do the research for what goes into each cell.
And now, a shameless plug: This is why we built matrix functionality into Spark, an AI solution for R&D intelligence. Because sometimes the best way to understand complex research landscapes is still the same simple approach humans have been using all along, just with AI doing the heavy lifting.
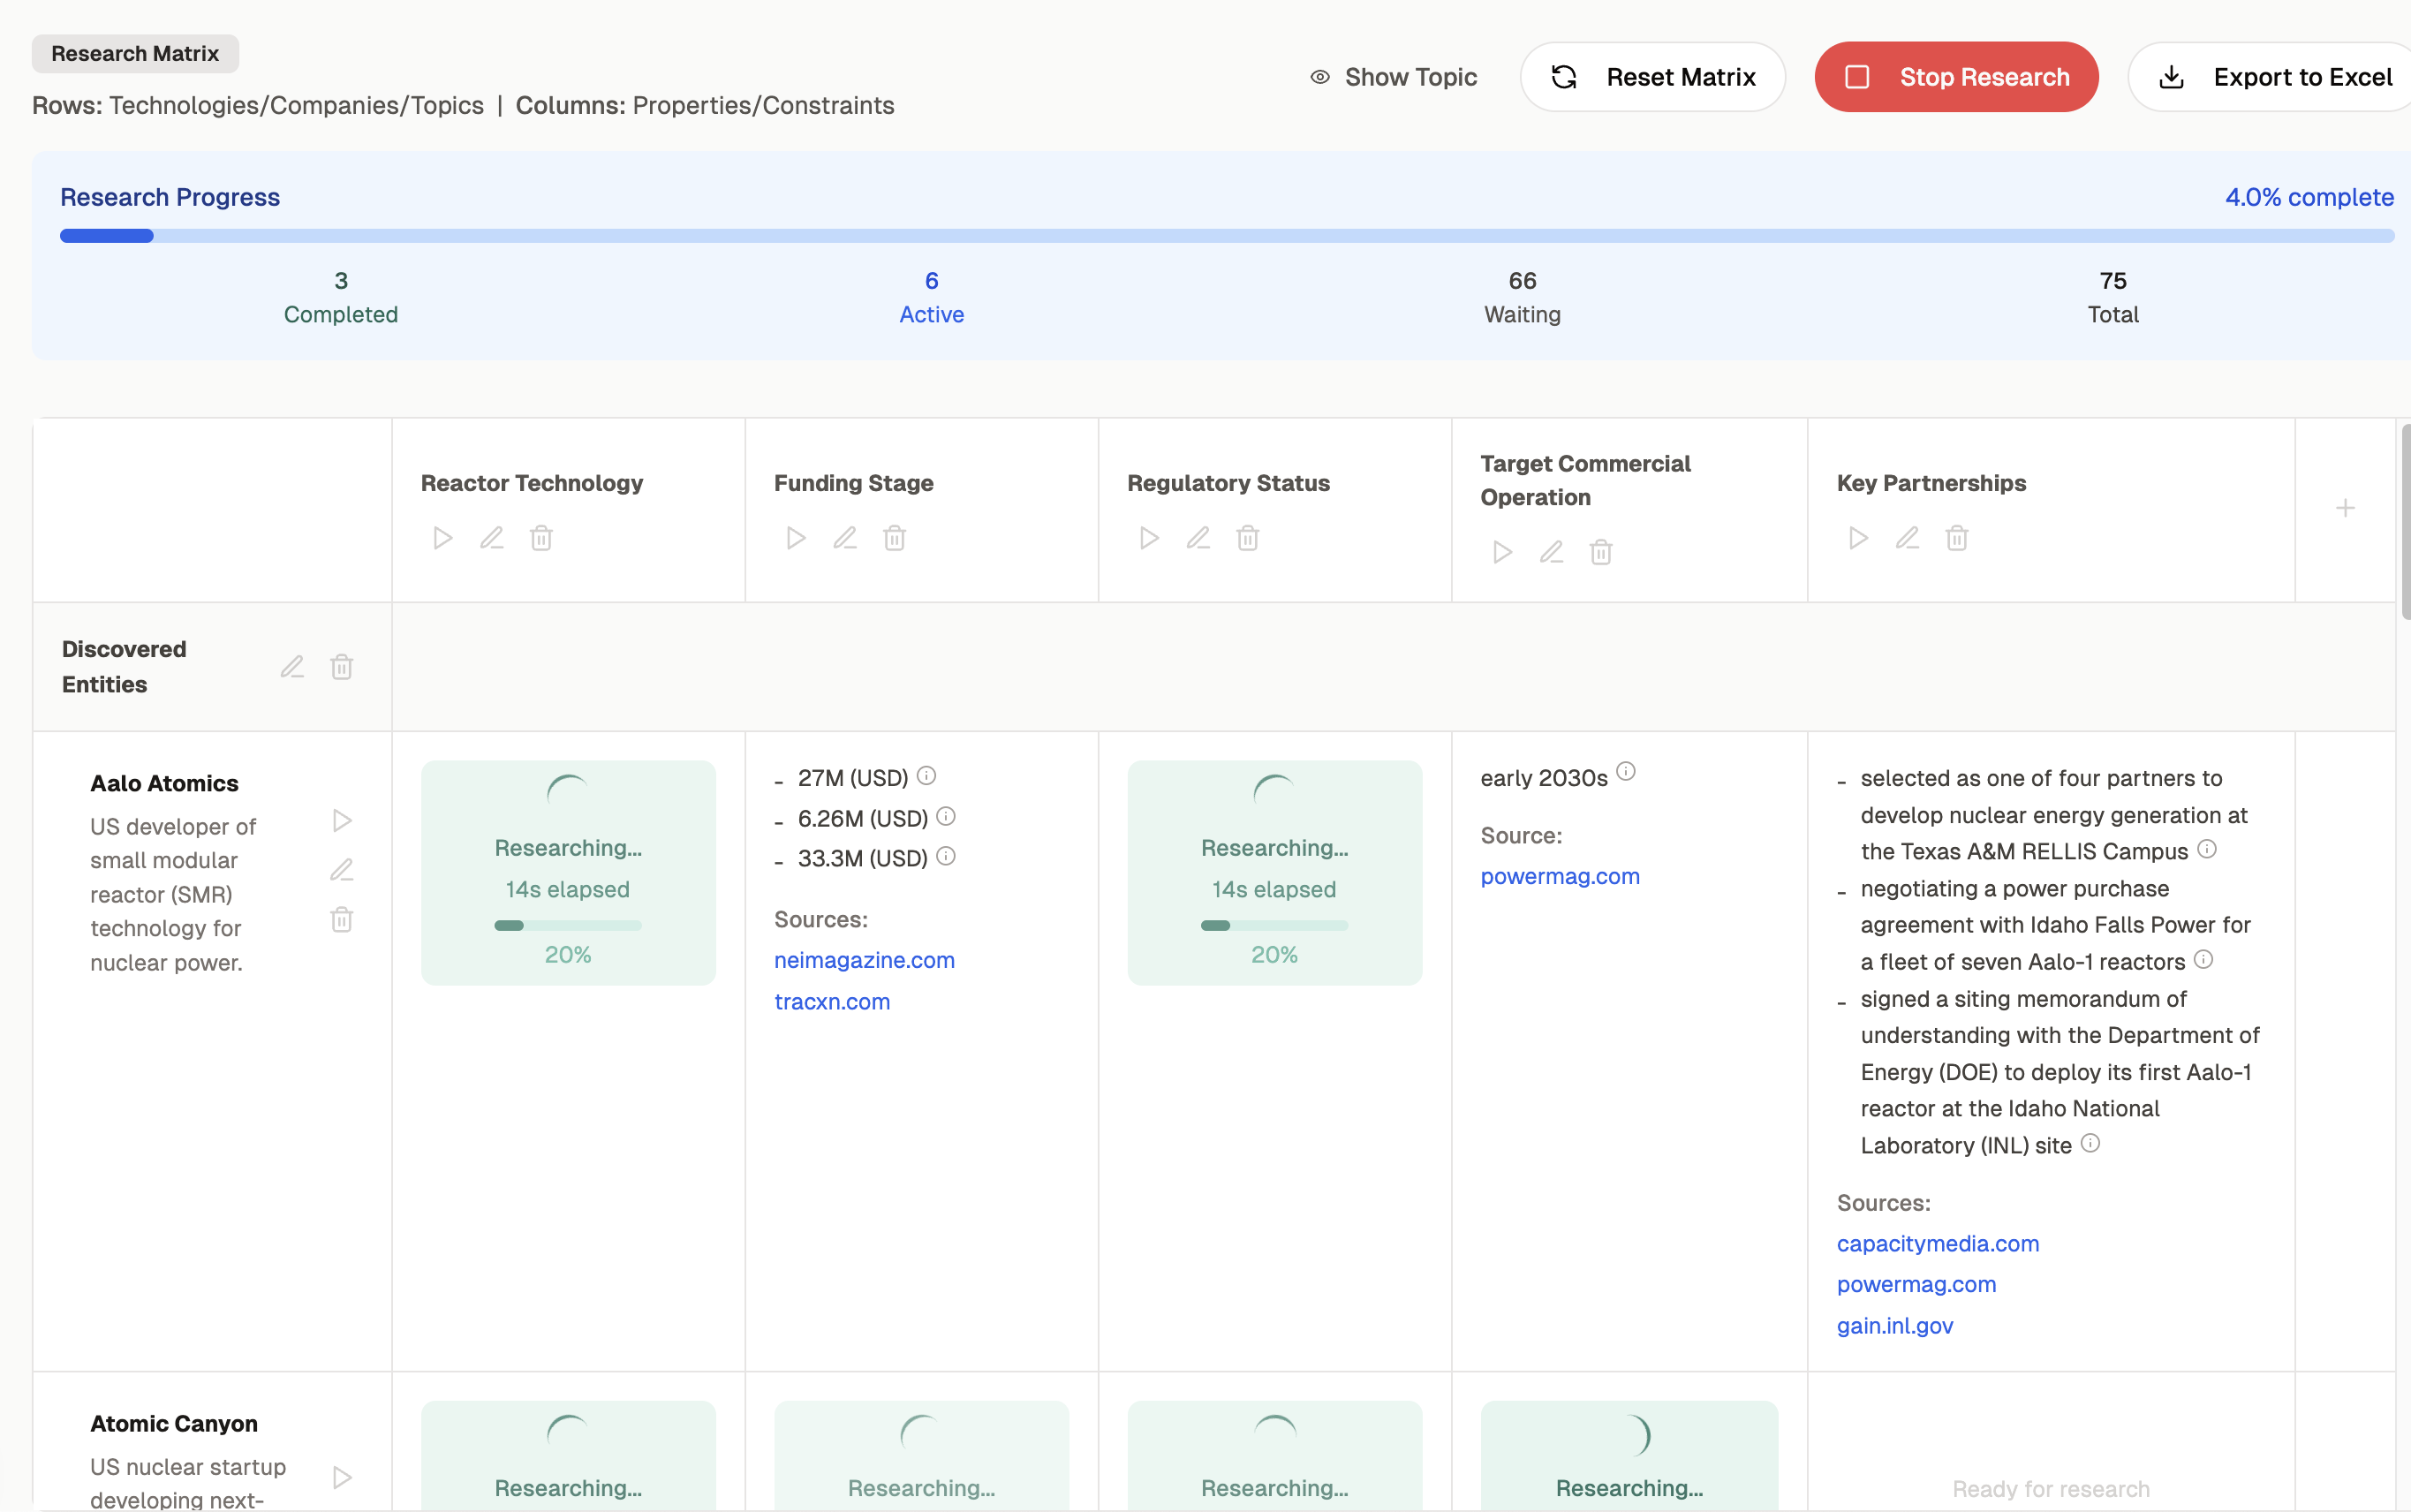
Spark Research Matrix: An AI research agent in every matrix cell.